Control Company Costs
A Look Inside Expenses: How Much Are Your Employees Spending?
Did you know that collectively, companies reimburse their employees billions of dollars each year? An employee expense could be as low as $2 for a coffee—or perhaps $6 for a fancy latte—and as these expenses add up, companies need to be thoughtful about how they guide this spending.
At SAP Concur, we want to make expense management as simple, automated, and accurate as possible so companies aren’t losing a cent to inaccurate forecasting, inefficient policies, or noncompliant purchases. With billions of dollars on the line, there’s a lot to lose.
To help companies understand the impact of inflation and gain a clear picture of the most common expense categories, we’ve analyzed Concur Expense data collected in 2019 and 2023.
Average Cost per Transaction
|
Category |
Pre-Pandemic - 2019 |
% Change |
Past year - 2023 |
|
Air |
$698 |
10% |
$770 |
|
Miscellaneous1 |
$182 |
19% |
$217 |
|
Other2 |
$182 |
11% |
$202 |
|
Car Rental |
$150 |
28% |
$192 |
|
Entertainment |
$123 |
28% |
$157 |
|
Office |
$127 |
14% |
$145 |
|
Lodging |
$116 |
21% |
$140 |
|
Telecom3 |
$90 |
9% |
$98 |
|
Train |
$75 |
-5% |
$71 |
|
Gas4 |
$43 |
37% |
$59 |
|
Meals |
$43 |
30% |
$56 |
|
Mileage5 |
$38 |
13% |
$43 |
|
Ground transportation |
$30 |
13% |
$34 |
|
Parking |
$25 |
12% |
$28 |
1Miscellaneous refers to expenses that don’t fit within current expense categories
2Other refers to non-standard expense categories
3Telecom includes wired and wireless telephone fees as well as the costs of phone and communication devices
4Gas refers to fuel expenses
5Mileage refers to reimbursement based on miles driven
Airfare was the most expensive purchase per transaction in 2023. The average expense for airfare was $770, up 10% from $698 in 2019. That’s more than three times the cost of any other expense report category. Yet, while airfare was certainly impacted by inflation, it isn’t the category most changed from 2019.
That category would be gas. Compared to 2019, when the average expense transaction was $38, the cost has increased 37% to $59. Even though gas prices have cooled from the all-time high of $5.016 per gallon in 2022, they’re still higher than before the pandemic.
Inflation, supply chain disruptions, and tariffs on certain imports have also resulted in higher prices for food and meals. The average expense transaction for meals has increased 30%, from $43 in 2019 to $56. Higher meal costs are here to stay, but future increases may not be as dramatic. Food prices only rose 2.7% between December 2022 and December 2023, compared to 10.4% over the same period in 2021 and 2022.
Interestingly, the average expense for train travel has dropped 5% from $75 in 2019 to $71. Trains are a more sustainable way to travel, so the reduced cost is good news for companies looking to swap car or plane travel for rail.
Spend by Expense Category as a Percentage of Total Spend

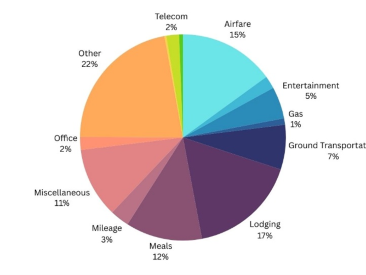
While airfare is the costliest per transaction, it’s not where we see the most spending. In 2023, 22% of expense spending across transactions in Concur Expense appeared in the “other” category. Indeed, it has become the most expensed category in terms of total spend increasing from 17% in 2019. The cost of expenses in the “miscellaneous” category also increased from 9% in 2019 to 11% in 2023.
“Miscellaneous” and "other” expense categories are the second- and third-most expensive, respectively, when looking at the cost of an average expense. These murky areas represent expenses that don’t fit within existing categories or refer to expense categories outside of the norm. For example, we saw an increase in “miscellaneous” and “other” expense categories during the pandemic when employees were expensing new home office equipment or PPE. In terms of the volume of expense transactions, those in the “other” and “miscellaneous” categories are increasing, making up nearly 20% of expense transactions. These are commonly-used expense types, but it’s important that companies have insight into what employees are spending on to ensure compliance with expense policies.
Other changes since 2019 include lodging overtaking airfare as the category with the third most spending. Lodging prices have increased 21% from $116 per expense transaction in 2019 to $140 in 2023. Like most expense categories, inflation has left its mark on the lodging industry. Indeed, separate research from Skift observed a 20% increase in hotel rates from 2019 to 2023.
“Inflation is certainly the main culprit when it comes to higher prices,” said Chris Juneau, head of market strategy at SAP Concur, “but the nuances in the data showing rising costs and shifts in spending habits provides valuable insights that should be used to guide business decisions, spending strategies, and travel and expense policies.”
Volume of Expense Transactions as a Percentage of all Transactions1
|
Expense Category |
2019 Percent |
2023 Percent |
|
Airfare |
3% |
2% |
|
Car Rental |
1% |
1% |
|
Entertainment |
3% |
3% |
|
Gas |
2% |
2% |
|
Ground Transportation |
22% |
22% |
|
Lodging |
16% |
14% |
|
Meals |
26% |
24% |
|
Mileage |
7% |
7% |
|
Miscellaneous |
5% |
6% |
|
Office |
1% |
2% |
|
Other |
9% |
12% |
|
Parking |
1% |
1% |
|
Telecom |
2% |
2% |
|
Train |
1% |
1% |
1Totals may not add up to 100% due to rounding
Our third look inside the data shows not how much is being spent, but how often employees are spending in each category. In a given year, the three most common expense categories based on volume of transactions, in order, are meals, ground transportation, and lodging. Nearly one in four expense transactions involve employee meals.
Business expense categories help companies track and manage outgoing spend. A robust list of expense types allows companies to increase oversight into employee spend and help establish guard rails on what can and can’t be expensed through expense policies.
Tips for Expense Policies
Managing employee spending across expense categories and payment methods can leave room for error and non-compliance. But with clear expense policies, organizations can reduce ambiguity and non-compliance, saving time and money while reducing risk. Consider these seven tips for developing or revising expense policies:
-
Review existing policies and elicit input from finance leaders and employees on what has been effective, what hasn’t, and what must be updated.
-
Tap technology to look at spend data. Reexamine your “other” or “miscellaneous” categories and find out what employees are spending on. This could result in adding new expense types or adjusting category names if they’re confusing. Learn more about common expense categories here.
-
Work with solution providers or industry experts to understand current economic, social, and behavioral conditions that might impact employee spending—for example, differences in how employees made purchases before and after return-to-office initiatives.
-
After gathering information, adjust policies to be fair and sensible. Write your policy to guide behavior but be flexible enough to adapt to local and international travel requirements. Be explicit about what is and isn’t an acceptable expense.
-
Remove the jargon from policies. Make sure they are easy to read and not bogged down by unfamiliar terms. The easier a policy is to understand, chances are better your employees will follow policy on their next business trip or purchase.
-
Make sure your policy is simple to find and use. Your expense policy won’t be followed unless people know about it; make it visible and include in internal communications.
-
Take a future-forward approach to technology. Without question, you should be using a mobile-first solution that makes it easy for employees to submit expenses on-the-go from their mobile devices. Additionally, ask about current AI-powered capabilities and how your technology partners are planning for the addition of generative AI for such things as helping employees better navigate expense policies.
Methodology: SAP Concur analyzed aggregate expense reports in Concur Expense between January 1, 2023, through December 31, 2023, and equivalent time periods from 2019. Expenses for this analysis were tagged as “airfare,” “car rental,” “entertainment,” “gas,” “ground transportation,” “lodging,” “meals,” “mileage,” “miscellaneous,” “office, “other,” “parking,” “telecom,” and “train.”